

My homelab monitoring used to be SSH plus guesswork. Whenever a VM felt slow, I would log into the wrong machine first, open htop, log out, and try the next one. Once the setup grew to a Docker host, two Proxmox nodes, and a handful of VMs, that habit stopped scaling.
So I replaced it with a proper monitoring stack. Prometheus collects the metrics, Grafana draws them as graphs and dashboards, and Alertmanager taps me on the shoulder when something crosses a threshold, like a disk getting close to full. Everything runs as Docker containers on one machine, while the machines being watched only run a lightweight exporter each.
This guide walks through the whole setup from scratch, including the part most tutorials leave out: pulling Proxmox VE metrics straight from its API with the PVE Exporter. Everything here was written and tested against Prometheus 3.15.1 and Grafana OSS 13.3.0, the current stable versions as of November 2026. If you are new to Prometheus and Grafana, just follow the steps in order, because each step prepares the files the next one needs.
What You Are Building #
Six containers run on a single Docker network:
| Container | Job | Port |
|---|---|---|
| prometheus | Scrapes and stores metrics | 9090 |
| grafana | Dashboards and visualization | 3000 |
| node-exporter | Hardware and OS metrics | 9100 |
| cadvisor | Per-container Docker metrics | 8080 |
| alertmanager | Alert notifications | 9093 |
| pve-exporter | Proxmox VE metrics over its API | 9221 |
Prometheus works on a pull model. Every 15 seconds it visits the /metrics URL of each target and stores whatever numbers it finds. Exporters are small programs whose only job is to serve those numbers: node-exporter reports a machine’s CPU, memory, and disks, cadvisor reports per-container stats, and pve-exporter asks the Proxmox API and translates the answers into Prometheus format. Grafana stores nothing itself, it only queries Prometheus and draws the results.
flowchart LR
    subgraph SOURCES["Monitored Targets"]
        direction TB
        NE["Node Exporter
(Host, VMs, PVE Nodes)
:9100"]
        CAD["cAdvisor
(Docker Containers)
:8080"]
        PVE["Proxmox VE Cluster
(API Status)"]
    end

    PVEEXP["pve-exporter
:9221"]
    PVE -->|API Token| PVEEXP

    subgraph CORE["Monitoring Stack (Docker)"]
        direction TB
        PROM["Prometheus
:9090
(Scrape & TSDB)"]
    end

    NE -->|Pull /metrics| PROM
    CAD -->|Pull /metrics| PROM
    PVEEXP -->|Pull /pve| PROM

    subgraph OUTPUT["Visualization & Alerts"]
        direction TB
        GRAF["Grafana
:3000
(Dashboards)"]
        AM["Alertmanager
:9093"]
        NOTIF["Notifications
(Telegram / Discord / Webhook)"]
    end

    PROM -->|PromQL Query| GRAF
    PROM -->|Send Alerts| AM
    AM --> NOTIF

    style PROM fill:#e6522c,stroke:#333,stroke-width:1px,color:#fff
    style GRAF fill:#f46800,stroke:#333,stroke-width:1px,color:#fff
Prerequisites #
- One Linux machine with Docker and Docker Compose installed. Two CPU cores and 4 GB of RAM is a comfortable minimum for this stack.
- SSH access to that machine, plus the other machines you want to monitor.
- At least one Proxmox VE node if you want the PVE part. Web UI access is enough, no Proxmox CLI knowledge needed.
- About an hour, most of it spent typing config files and waiting for images to download.
Step 1. Create the Project Folders #
mkdir -p monitoring-stack/prometheus monitoring-stack/alertmanager monitoring-stack/grafana/provisioning/datasources
cd monitoring-stack
Each folder has one job:
prometheus/holdsprometheus.ymlandalert_rules.ymlalertmanager/holdsalertmanager.ymlgrafana/provisioning/datasources/can hold a file that registers the Prometheus data source automatically
Technical reasoning: the config files live outside the containers on purpose. That way you can edit them with a normal text editor and reload Prometheus without rebuilding anything.
Step 2. Configure Prometheus #
Create prometheus/prometheus.yml with the following content, and swap the IP addresses for your own:
global:
  scrape_interval: 15s
  evaluation_interval: 15s

alerting:
  alertmanagers:
    - static_configs:
        - targets: ["alertmanager:9093"]

rule_files:
  - "alert_rules.yml"

scrape_configs:
  - job_name: "prometheus"
    static_configs:
      - targets: ["localhost:9090"]

  - job_name: "node-exporter"
    static_configs:
      - targets: ["node-exporter:9100", "10.1.1.20:9100", "10.1.1.10:9100", "10.1.1.200:9100", "100.114.62.179:9100"]

  - job_name: "cadvisor"
    static_configs:
      - targets: ["cadvisor:8080"]

  - job_name: "pve"
    static_configs:
      - targets:
        - 10.1.1.20  # Proxmox VE node 1
        - 10.1.1.10  # Proxmox VE node 2
    metrics_path: /pve
    params:
      module: [default]
      cluster: ['1']
      node: ['1']
    relabel_configs:
      - source_labels: [__address__]
        target_label: __param_target
      - source_labels: [__param_target]
        target_label: instance
      - target_label: __address__
        replacement: pve-exporter:9221  # PVE exporter
One small extra file so Prometheus can start right away. We fill it in properly at Step 10:
echo "groups: []" > prometheus/alert_rules.ymlTechnical reasoning: three things in that file deserve a closer look:
- Inside a Docker network, containers reach each other by service name. The
node-exporter:9100target is a container from our own compose file, so it automatically watches the Docker host itself. - The IP targets are machines that run node exporter natively, not through Docker. In my case that is two Proxmox nodes at
10.1.1.20and10.1.1.10, a VM at10.1.1.200, and one small box I reach over VPN (which is why that last IP starts with100.). Replace all of them with your own addresses. - The
pvejob looks strange but the logic is simple. Prometheus never connects to those node IPs directly. The threerelabel_configslines rewrite the scrape so the actual request goes topve-exporter:9221, with the node address carried along as a parameter. One pve-exporter container ends up serving every Proxmox node, and each node keeps its owninstancelabel.
The alerting and rule_files blocks point at Alertmanager and the alert rules file we create in the coming steps.
Step 3. Prepare the Proxmox Nodes #
Two jobs happen here, both on the Proxmox side and neither in Docker. First, each Proxmox node gets node exporter from the Debian repository. Second, you create an API token so the PVE exporter is allowed to read cluster data.
Install Node Exporter on Each Node #
SSH into every Proxmox node and run:
apt update
apt install prometheus-node-exporter
The package starts itself as a systemd service and serves metrics on port 9100. A quick check:
systemctl status prometheus-node-exporter
curl -s localhost:9100/metrics | head
This is why the node-exporter job in prometheus.yml lists the node IPs with port 9100. No Docker needed on the Proxmox side, the apt package is enough.
Create a User and an API Token #
The PVE exporter reads data through the Proxmox API, so it needs a token with read permission. In the web UI:
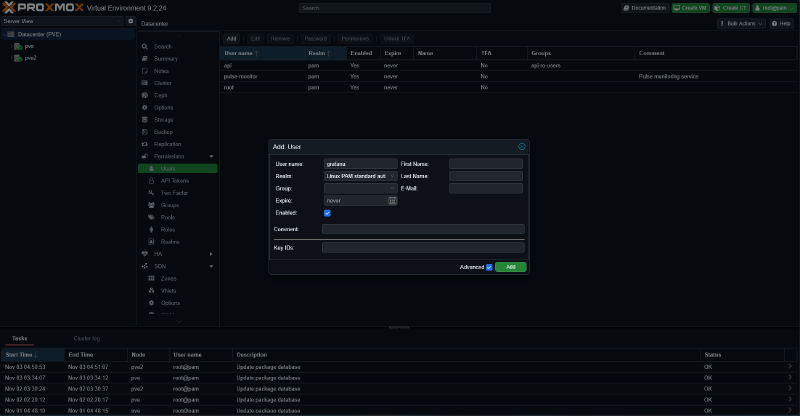
- Open Datacenter > Permissions > Users, click Add. Name it
grafanawith the Linux PAM realm, so its full identity becomesgrafana@pam.
- Move on to Datacenter > Permissions > API Tokens, click Add. Pick the user
grafana@pam, set the Token ID tografana, and leave Privilege separation unchecked so the token simply inherits the user’s permissions.

-
Once the dialog closes, the token secret (a UUID) is shown exactly once. Copy and save it somewhere, because you cannot view it again later.
-
Finally, grant read access. Open Datacenter > Permissions > Add > User Permission, set Path to
/, pick the usergrafana@pam, and choose the PVEAuditor role.
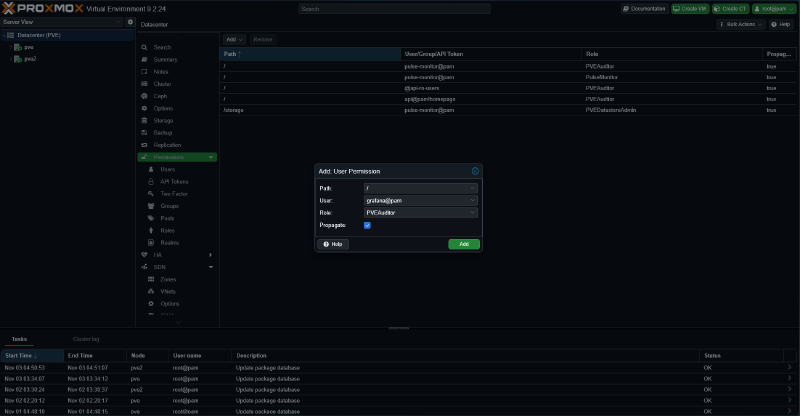
Technical reasoning: a permission set at the Datacenter level (path /) applies to every node in the cluster. Both of my nodes sit in one cluster, so the single grafana@pam token covers 10.1.1.20 and 10.1.1.10 at once. If your nodes are standalone (not clustered), repeat the user, token, and permission steps on each node separately.
The pve.yml Credentials File #
Create pve.yml in the project root:
default:
  username: grafana@pam
  token_name: grafana
  token_value: xxxxxxxx-xxxx-xxxx-xxxx-xxxxxxxxxxxx
  verify_ssl: false
Replace token_value with the secret you copied. verify_ssl: false is usually needed in a homelab because Proxmox certificates are self-signed.
Step 4. Write the Docker Compose File #
Create compose.yml in the project root. The image versions are pinned to the current stable releases, Prometheus v3.15.1 and Grafana 13.3.0:
services:
  prometheus:
    image: prom/prometheus:v3.15.1
    container_name: prometheus
    volumes:
      - ./prometheus:/etc/prometheus
      - prometheus-data:/prometheus
    command:
      - "--config.file=/etc/prometheus/prometheus.yml"
      - "--storage.tsdb.retention.time=15d"
    ports:
      - "9090:9090"
    restart: unless-stopped
    networks:
      - frontend

  grafana:
    image: grafana/grafana-oss:13.3.0
    container_name: grafana
    volumes:
      - grafana-data:/var/lib/grafana
      - ./grafana/provisioning:/etc/grafana/provisioning
    ports:
      - "3000:3000"
    environment:
      - GF_SECURITY_ADMIN_PASSWORD=changeme_now
    restart: unless-stopped
    networks:
      - frontend

  node-exporter:
    image: prom/node-exporter:latest
    container_name: node-exporter
    pid: host
    volumes:
      - /proc:/host/proc:ro
      - /sys:/host/sys:ro
      - /:/rootfs:ro
    command:
      - "--path.procfs=/host/proc"
      - "--path.sysfs=/host/sys"
      - "--path.rootfs=/rootfs"
    ports:
      - "9100:9100"
    restart: unless-stopped
    networks:
      - frontend

  cadvisor:
    image: gcr.io/cadvisor/cadvisor:latest
    container_name: cadvisor
    volumes:
      - /:/rootfs:ro
      - /var/run:/var/run:ro
      - /sys:/sys:ro
      - /var/lib/docker/:/var/lib/docker:ro
    ports:
      - "8080:8080"
    restart: unless-stopped
    networks:
      - frontend

  alertmanager:
    image: prom/alertmanager:latest
    container_name: alertmanager
    volumes:
      - ./alertmanager:/etc/alertmanager
    ports:
      - "9093:9093"
    restart: unless-stopped
    networks:
      - frontend

  pve-exporter:
    image: prompve/prometheus-pve-exporter
    container_name: pve-exporter
    volumes:
      - ./pve.yml:/etc/prometheus/pve.yml
    ports:
      - "9221:9221"
    environment:
      - PROXMOX_VE_USERNAME=grafana@pam
      - PROXMOX_VE_TOKEN_NAME=grafana
      - PROXMOX_VE_TOKEN_VALUE=xxxxxxxx-xxxx-xxxx-xxxx-xxxxxxxxxxxx
    restart: unless-stopped
    networks:
      - frontend

volumes:
  prometheus-data:
  grafana-data:

networks:
  frontend:
    external: true
A few things worth noting in that file:
- Change
GF_SECURITY_ADMIN_PASSWORDbefore the first start. - The two named volumes (
prometheus-dataandgrafana-data) keep data alive across restarts. Without them, everything is gone after everydocker compose down. - The
pve-exporterenvironment block repeats the same credentials aspve.yml. If the two ever disagree, the environment variables win, so pick one as your source of truth and keep them in sync. - Node exporter runs with
pid: hostand a few read-only mounts so it can see the host’s real processes and filesystems instead of the inside of its container. cAdvisor needs similar mounts to inspect the other containers. --storage.tsdb.retention.time=15dmeans Prometheus keeps 15 days of data. If disk space is tight, lower the value or add--storage.tsdb.retention.size.
About the frontend network: I reuse a shared external Docker network that already existed in my homelab, the same one from my Traefik guide. If you do not have one, create it first with docker network create frontend, or just delete every networks: block above and let Compose create a default network for the project.
Step 5. Configure Alertmanager #
Create alertmanager/alertmanager.yml:
route:
  group_by: ["alertname"]
  group_wait: 30s
  group_interval: 5m
  repeat_interval: 4h
  receiver: default-webhook

receivers:
  - name: default-webhook
    webhook_configs:
      - url: http://your-webhook-example/
        send_resolved: true
The route section decides how alerts get grouped and delivered. Alerts with the same name are merged into one notification through group_by, there is a 30 second wait before the first delivery (group_wait), and an alert that stays active is sent again every 4 hours (repeat_interval). The receiver in this example is a webhook. You can swap it for Telegram, Discord, or email later, the configuration formats are in the official Alertmanager docs.
As long as no alert is active, Alertmanager sends nothing, so a placeholder webhook URL like this one is harmless for now.
Step 6. Start the Stack #
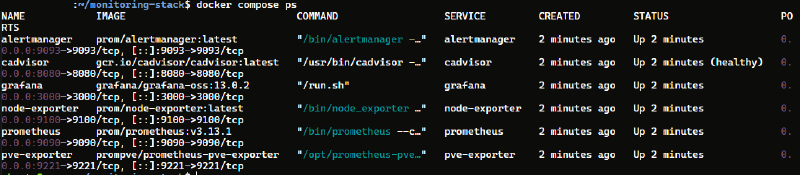
docker compose up -d
docker compose ps
You should see six containers, all Up. A container stuck in Restarting almost always means a volume mount points at a file that does not exist. Double-check the paths; the most common offender is a forgotten pve.yml.
Step 7. Check the Prometheus Targets #
Open http://localhost:9090/targets (swap localhost for the machine’s IP if you are browsing from your laptop). You should see nine green targets: Prometheus itself, five node-exporter instances, cadvisor, and two pve entries, one per Proxmox node. The pve entries show the node IPs rather than the exporter IP, which is the relabel from Step 2 doing its job.
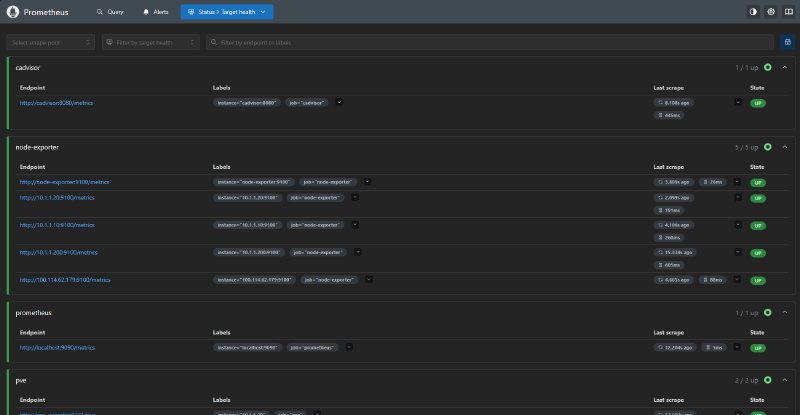
A DOWN target usually means a wrong IP, an exporter that is not running on that machine, or a firewall in between. Click the target to read the error message.
Step 8. Connect Grafana to Prometheus #
Log into http://localhost:3000 with the user admin and the password you set in compose. Open Connections > Data sources > Add data source, pick Prometheus, set the URL to http://prometheus:9090, then click Save & Test.
http://prometheus:9090, not localhost. Grafana runs in its own container, and localhost inside that container points at Grafana itself, not at Prometheus. This is the single most common beginner mistake.
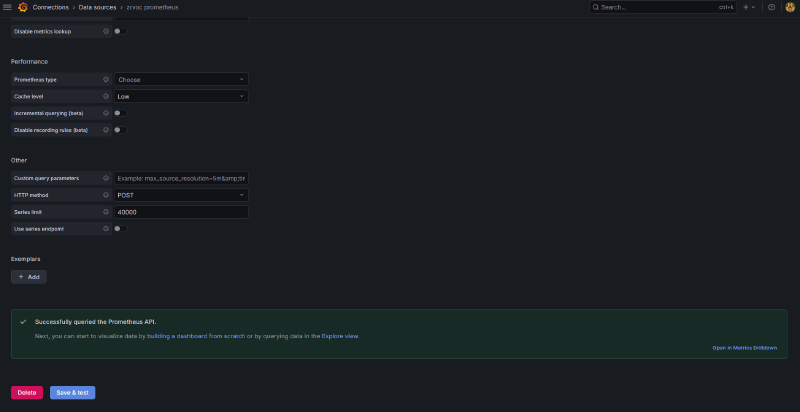
If you prefer the data source to exist without any clicking, create grafana/provisioning/datasources/prometheus.yml:
apiVersion: 1
datasources:
  - name: Prometheus
    type: prometheus
    access: proxy
    url: http://prometheus:9090
    isDefault: true
    editable: true
With this file in place before the first start, the data source is ready the moment Grafana boots.
Step 9. Build the Grafana Dashboards #
Build the first panel by hand once, so the concept sinks in. Create a new dashboard through Dashboards > New > Add visualization, pick the Prometheus data source, and enter this query:
rate(node_cpu_seconds_total{mode="idle"}[5m])This measures how fast idle CPU time accumulated over the last five minutes, per core. The busier the machine, the smaller the number.
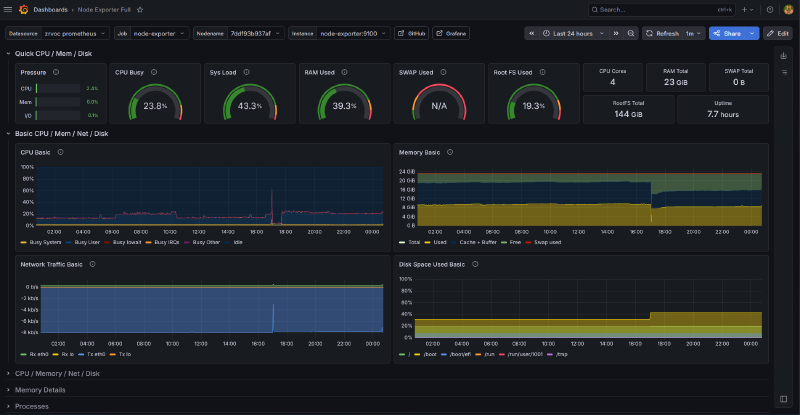
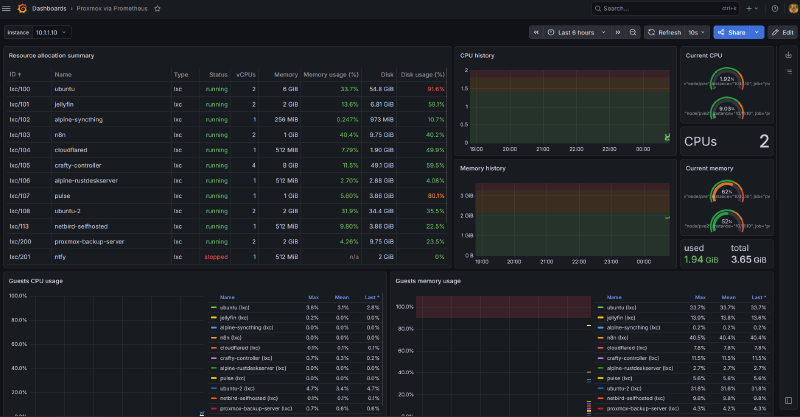
Once that makes sense, community dashboards are far more practical. Open Dashboards > Import and enter these IDs:
- 1860, Node Exporter Full (dashboard page): a complete view of one machine, from CPU and memory to disks and network. After importing, pick a machine from the Host dropdown. Every machine from the
node-exporterjob shows up there, both the apt-installed ones and the containerized one. - 893, Docker and System Monitoring (dashboard page): a per-container view powered by cadvisor.
- 10347, Proxmox via Prometheus (dashboard page): a cluster and node view fed by the pve-exporter data.
Step 10. Alert Rules #
Now fill in the placeholder prometheus/alert_rules.yml from Step 2:
groups:
  - name: host-alerts
    rules:
      - alert: HighCPUUsage
        expr: 100 - (avg by (instance) (rate(node_cpu_seconds_total{mode="idle"}[5m])) * 100) > 85
        for: 5m
        labels:
          severity: warning
        annotations:
          summary: "High CPU usage on {{ $labels.instance }}"
          description: "CPU usage has been above 85% for 5 minutes on {{ $labels.instance }}."

      - alert: LowDiskSpace
        expr: (node_filesystem_avail_bytes{mountpoint="/"} / node_filesystem_size_bytes{mountpoint="/"}) * 100 < 10
        for: 10m
        labels:
          severity: critical
        annotations:
          summary: "Low disk space on {{ $labels.instance }}"
          description: "Root filesystem free space is below 10% on {{ $labels.instance }}."
The first rule flips the idle number from earlier into a CPU usage percentage per machine (avg by (instance)), then fires the alert above 85%. The for: 5m line means the condition must hold for five minutes before the alert counts. That is what keeps a 30 second CPU spike from paging you. The second rule watches free space on the root filesystem and goes critical when it stays below 10% for ten minutes.
Apply the change without restarting:
curl -X POST http://localhost:9090/-/reloadCheck http://localhost:9090/alerts, both rules should appear as Inactive. The lifecycle goes Inactive (all fine), Pending (condition true but the for duration has not elapsed), then Firing (the alert is sent to Alertmanager).

Common Mistakes to Avoid #
- Using
localhostin scrape targets or the Grafana data source. Inside a container network,localhostpoints at the container itself. Use service names or machine IPs. - Skipping the named volumes. Without volumes, every metric and dashboard is wiped on each
docker compose down. - Keeping the default Grafana password. Especially if port 3000 is reachable from outside.
- Ignoring disk growth. Prometheus keeps writing for 15 days. Watch the size of the
prometheus-datavolume, or lower the retention. - Editing rules without reloading. Changes to
alert_rules.ymlonly apply after you call the/-/reloadendpoint or restart the container. - Mixing up node exporter and cadvisor numbers. One reports the host, the other reports containers. A 90% memory reading in cadvisor is container usage, not the machine’s.
- Writing alerts without a
for. Without a duration, a momentary spike becomes a notification.
Quick Troubleshooting #
| Symptom | Likely cause | First check |
|---|---|---|
Target DOWN in /targets |
Exporter not running, or wrong IP/port | docker compose ps, then curl the /metrics URL from the Prometheus side |
Grafana panels show No data |
Data source URL uses localhost |
Change it to http://prometheus:9090 |
| cAdvisor exits immediately | An incomplete mount | Compare the volumes block with the example above |
| pve-exporter keeps restarting | Missing pve.yml or wrong token |
docker logs pve-exporter |
| Alertmanager refuses to start | Invalid YAML | docker logs alertmanager, or validate with amtool check-config |
| YAML error in Prometheus | A typo in prometheus.yml |
docker logs prometheus, the message names the exact line |
FAQ #
Are Prometheus and Grafana free? Yes. Both are open source and run on your own server without license costs. What you pay for is the hardware underneath.
How much RAM does this stack need? For the scale in this guide, 4 GB of RAM and 2 cores are comfortable. Usage grows with the number of targets and the retention length.
Can Grafana work without Prometheus? Yes. Grafana supports many other data sources, including Loki, InfluxDB, and plain SQL databases. Prometheus is just the most common choice for metrics.
What if my main machine is Windows? Docker Desktop with the WSL 2 backend can run this stack. The catch is that node exporter cannot properly report Windows host metrics, so CPU and memory numbers for the Windows host will be off.
How long is data kept? In this guide’s configuration, 15 days, set by --storage.tsdb.retention.time=15d. Raise or lower it to match your disk. Existing data survives upgrades as long as the named volumes are kept.
Wrapping Up #
Every machine in the homelab, the Docker containers, and the Proxmox cluster are now visible from one Grafana page, with two alerts standing guard over CPU and disk. Sensible next steps: swap the Alertmanager webhook for a notification channel you actually read, add exporters for specific applications, and tune the retention to your disk.
If a step got stuck or your result looks different from what is written here, tell me in the comments and I will help you look into it.